Why nature is so difficult to predict
“Ecology is not rocket science. It’s way more complicated.” — Armel Castellan, Michael Allen, and others
By DR. CAMERON BARROWS
Not to demean rocket science, but to get a rocket into space, the primary variables are thrust, mass, and trajectory. Control those three variables and you can send a rocket almost anywhere. My dad was an aerospace engineer who calculated the design specs for the heat shields that got both the Apollo and Space Shuttle astronauts back home safely. He did it all with a slide rule, never needing to adopt those new-fangled computers. Nevertheless, “rocket science” entered our lexicon in the 1950s, 60s, and 70s, becoming the paragon of challenging analyses and complexity by which all other endeavors were compared.
In today’s world of change, including climate, pollution, changing fire regimes, invasive non-native species, and fragmentation of natural landscapes, ecologists, including naturalists, are being asked to predict the effect of those compounded changes on species and on whole natural communities. In the short term, to survive species may need to shift their populations to track environmental change and stay more or less within the conditions where they have evolved to thrive. Using a simple approach, climate change is predicted to affect both rainfall and temperature. So, using those two variables along with models that predict how increasing levels of atmospheric carbon dioxide will likely change rainfall and temperatures at any given location, we can develop predictions of where species need to move to stay within their preferred climate envelope. But is it that easy?
Species interact with other species. Predators need their prey, and their prey need plants. Animals use plants for food, a source of oxygen, thermal refugia, and hiding places from predators. Pollinators need their plants and plants need their pollinators. Plants need to interact with the microbial life in soils to facilitate nutrient uptake and maximize water use efficiency. Without these critical connections, whether a species thrives or declines may not reflect their ability to tolerate a warmer future, but reflect whether essential interspecific connections are maintained. Looking across a desert hillside, we more often see patches where one shrub species seems to dominate side be side with patches where a different species dominates. These differences may reflect fine-scale patterns in temperature and rainfall, but also echo unseen below ground patterns in soil moisture, nutrient availability, microbial activity, or perhaps a history of fire or some other disturbance. Or they may simply be a mirror of where seeds happen to land and germinate. Then there is the reality that even within a species there is genetic variability, and that variability can dictate where individuals can thrive, and where they can’t. Nature is complicated, not a reflection of two or three variables.
With this complexity, how do we do science? How do we make informed predictions (hypotheses) and then test those predictions? One approach is to identify the importance of individual variables in isolation using greenhouse experiments. While that can provide valuable insights, its shortcoming is that it measures responses in isolation. Nature doesn’t do anything in isolation. Another approach is to model responses using increasingly sophisticated computer-based scenarios. Again, valuable insights are generated, but computer-generated landscapes are never as complicated as nature is. Ultimately, coupled with insights provided by greenhouse experiments, and/or computer models, we need to measure how species are responding to environmental change where they live, in nature.
Measuring how species are responding to human-generated change in situ, in nature, is a critical step, but it is not easy. One mistake is to forget about nature’s inherent complexity, and assume a homogeneous “pallet” upon which plants and animals live and interact. Making that mistake, a research design that intends to measure if species are shifting up in elevation might create a single plot at 100 m elevation, another at 200 m, at 300 m, and so on until the species in question no longer occurs, and measure that species’ abundance over time. The mistake in such a design is that due to the complexity in nature, any one of those plots may have idiosyncratic characteristics that render it more suitable or less suitable for that species’ existence. Perhaps there is a difference in slope direction (south facing being hotter and drier, north being cooler and incrementally wetter), or there are differences in soil water, perhaps a fault bringing deeper groundwater close to the surface where plants can access it. Perhaps one site has shallow, rocky soils, while another has deeper soils with more organic content.
The way to deal with this natural complexity is to have multiple plots at each elevation strata, so that the data collected can show that “on average” a species is more or less abundant at 300 m than 200 m and that those differences are statistically meaningful. With single plots for each elevation category all one could say is that the observed between-plot differences reflect those plots, not a general pattern or tendency for where that species finds its preferred conditions. Needing multiple plots at each elevation is, in science jargon, referred to as having replicates, and the more replicates one has, the more power they have to identify real differences if those differences exist. Without replicates, any findings with respect to how species might be responding to change are open to question.
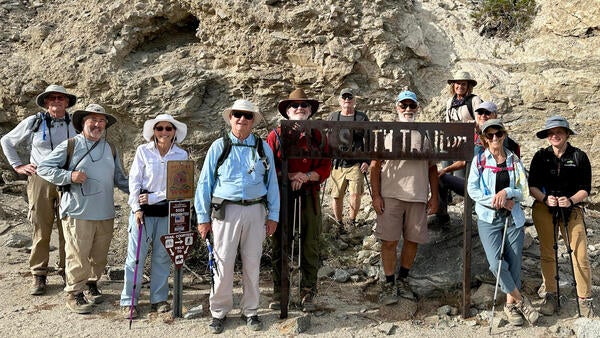
The challenges of collecting data across many plots, and across many years are not trivial. That alone is why few studies are being conducted. However, volunteer, community science-based research is opening up opportunities where only barriers once existed. Our community scientists are now conducting surveys of lizard communities across about 30 trails with overlapping elevations extending from 100 m to 2500 m in elevation. Each trail is surveyed at least twice a year, year after year. The data being collected are invaluable.
