Asking why?
“I have steadily endeavoured to keep my mind free, so as to give up any hypothesis, however much beloved (and I cannot resist forming one on every subject), as soon as the facts are shown to oppose it.” — Charles Darwin
My basic question when comparing populations between two of more areas or comparing the same area between years, and when those two populations differ in abundance, is why? Were there differences in rainfall? Were there differences in plant species and/or abundance (food)? Did one include an invasive species that the other lacked? Or was it something else?
In deserts, which are of course defined by their levels of aridity, rainfall differences between years or along a rain shadow gradient are the likely suspect for explaining those differences. We call that a “bottom-up” driver. Rainfall begets plants; plants beget seeds and insects; seeds and insects beget lizards. More rain should equal more lizards; less rain, fewer lizards. Inputs (rain) workup through the food web, and so rain is a bottom-up driver of species abundance.
In other systems the “drivers” can be turned upside down and be “top-down” influences. The classic example is with ocean tidepools. Robert Paine wondered why tide pools differ so much in the types and abundance or species. He and his students manipulated the abundance of the top predator, a starfish, to see how that would influence species richness and abundance. When starfish were present, the tide pool had the highest number of species (species richness), but when the starfish were absent the tide pool was dominated by a single species, mussels. Without starfish to eat the mussels, the mussels occupy every space, leaving no room for other species. As starfish are the top predators, they have a top-down influence on species occurrence and abundance.
Another example is the relationship between Orcas, sea otters, sea urchins, and kelp beds. James Estes, in his book “Serendipity”, described how otters control the urchins (which eat the kelp). If the otters can control the urchins the kelp thrives and creates a nursery for a myriad of other sea life. However, if local Orcas develop a taste for otter, no one eats the urchins and the kelp and its nursery disappears. Top-down.
Of course, these oceanic ecosystems are not limited by rainfall. It is hard to imagine how a desert ecosystem could also be structured by a top-down driver. Nevertheless, I recently chatted with a young scientist from UC Berkeley, Clay Noss, who showed it could happen. Clay studied a lizard community at White Sands National Monument in the Chihuahua Desert of New Mexico. He found that if a predator thinned the lizards near zero, then the abundance of the lizards’ insect prey increases, which then have a negative impact on plants. Top-down.
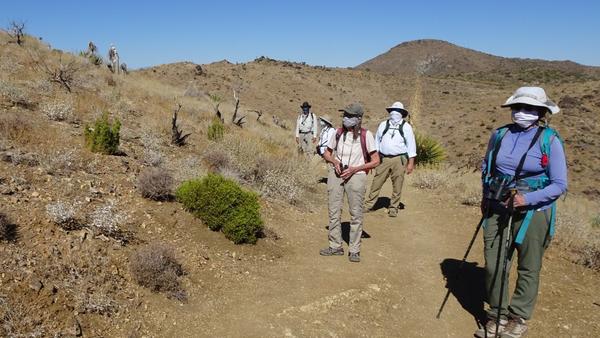
All the above was a long, winding path to set the stage for a question of why our community science team counted so few lizards up in Joshua Tree National Park last week. It has been a dry summer in the park, where more typically there are regular summer monsoon rains which cool the air and dampen the soil. Drier soils, hotter soils, could result in lower lizard hatchling survival and fewer insects to eat for those that lizards do hatch. Bottom-up. But we also saw an unusually high number of California scrub jays. The jays were there to eat an unusually abundant acorn crop, but they are omnivores and so would not turn down a lizard hors d’oeuvres if available. Top-down. Which was right?
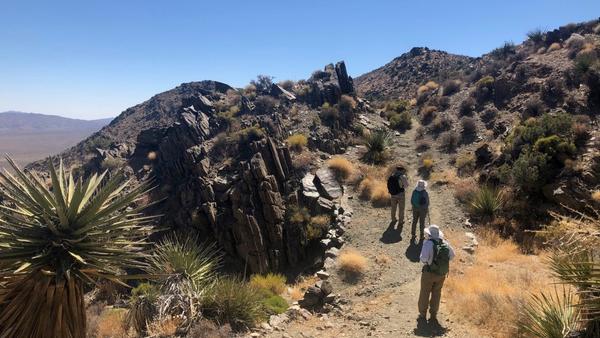
Yesterday our community science team conducted a lizard survey on the Park’s Lost Horse Mine trail. Same elevation as last week’s survey (and the week before that), but much further east, and so should be drier. The other difference was that there were no jays. The difference was stark. Two weeks ago, on the West End Loop trail, we saw 4.1 side-blotched lizards / km. Last week on the adjacent Panorama Loop trail we saw a similar 5.6 side-blotched lizards / km. Yesterday, on the more eastern Lost Horse Mine trail we saw 39.7 side-blotched lizards / km before lunch (after lunch it got pretty warm and the lizard activity much less). If it was just greater aridity, the numbers should have been similar or less than the more western trail surveys. Top-down is looking like a contender. We will be conducting more surveys over the next few weeks to see if the pattern described above is consistent.
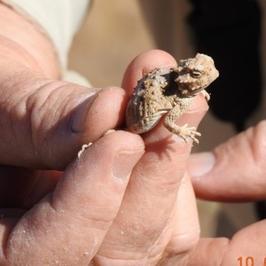
Of course, that wasn’t the only hypothesis were tested. There had been a wildfire in 2006 that burned through a portion of the habitat the trail passed through. We wondered if the fire had reduced the habitat quality for the lizards. On the burned portion of the trail we saw 50 side-blotched lizards / km, on the unburned section we saw 28 side-blotched lizards / km. Looks like the fire didn’t harm the lizards. Then community scientist Donna spied a hatchling desert horned lizard in the burned area. What a great day.


